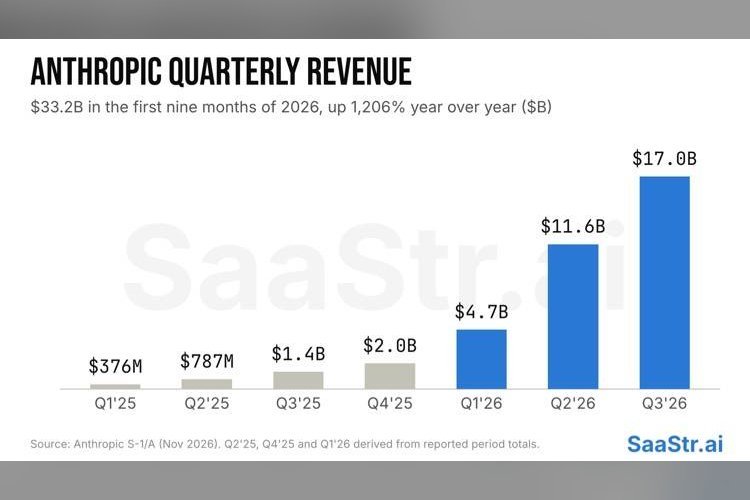
The Anthropic S-1 shows a company growing at a pace no software firm has matched. Revenue went from $41 million in 2023 to $386 million in 2024 and $4.585 billion in 2025. Through the nine months to Sept. 30, 2026, it hit $33.24 billion, about 1,200% above the same stretch of 2025.
Few businesses will match that growth. The operating numbers beneath it travel better, and ten of them stand out.
Retention and big accounts
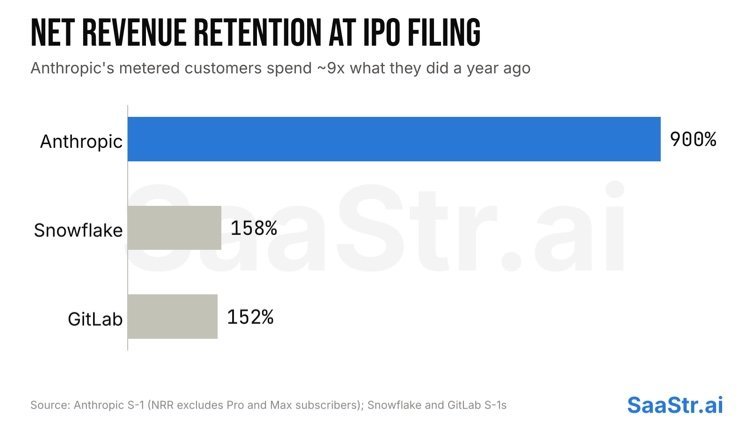
Anthropic reports net revenue retention of about 900%. Customers who were already on board spent about nine times more in the September quarter than they had a year before. The figure excludes Pro and Max subscribers, so all of it comes from metered accounts. Snowflake filed at 158% and GitLab at 152%. A seat-priced product tends to top out around 120% to 130%, because customers can only add so many seats.
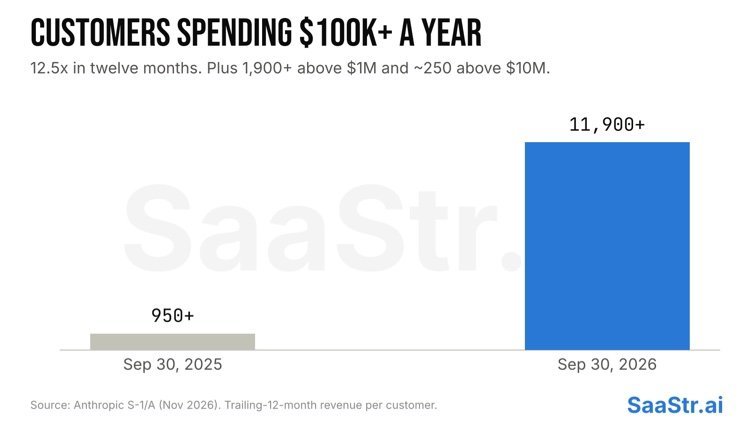
The count of customers spending $100,000 or more over the trailing twelve months jumped from more than 950 to more than 11,900 in a year. More than 1,900 are above $1 million and about 250 are above $10 million. The Anthropic S-1 also lists about 40 million customers below the $100,000 mark.
Margins and compute
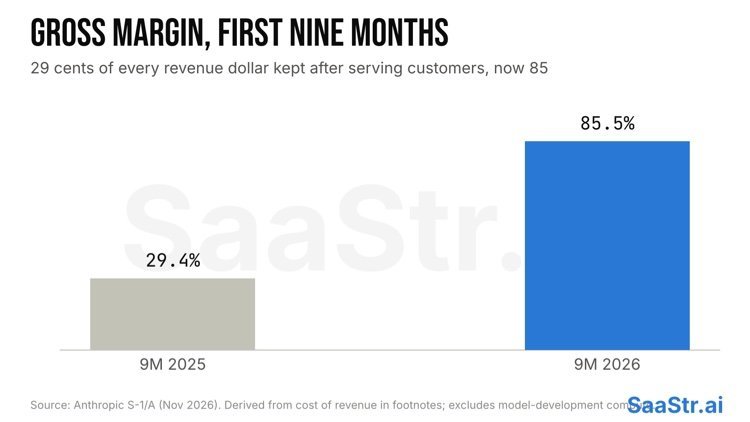
In the amended prospectus, cost of revenue is $4.812 billion on $33.242 billion of sales across nine months of 2026. That implies an 85.5% gross margin, compared with 29.4% a year before. Two caveats: the company dropped gross margin from its income statement, so the figure comes from footnotes, and the roughly 85% leaves out what it spends developing models.
Compute costs did not fall in a straight line. In the second quarter, revenue jumped 1,368% from a year earlier while compute costs grew 300%. In the third quarter, compute climbed from 48% to 58% of revenue. Anthropic also disclosed purchase commitments of $895.4 billion.
Sales and marketing came to $3.808 billion in the first half, about 23.4% of revenue, even at growth above 1,000%.
Where the money comes from
- Pay-as-you-go usage generated $26.3 billion (79% of revenue) over nine months, and subscriptions $6.9 billion (21%).
- Cloud marketplaces accounted for 48% of first-half revenue, reported gross, and 58% of receivables. Buyers purchase through AWS, Google Cloud and Azure to draw down committed cloud spend.
- Over half of the $100,000-plus accounts now use both the Claude Platform and an Anthropic app, versus about 30% in late 2025.
Usage revenue has a downside, and the Anthropic S-1 shows it. Spending dropped roughly 20% in the fortnight to Jan. 2, 2026 against the fortnight to Dec. 19, 2025, as engineering teams went on holiday.
Share of the enterprise budget
More than half the Fortune 500 pay Anthropic at least $100,000 a year. For the listed companies among them, that spend averages less than $1 for every $1,000 they spend overall. The ten biggest Fortune 500 customers put in over eight times that average share and still stay under 1%.
The comparison is against total expenses, not IT budgets, which suggests Anthropic is chasing money now spent on people, services and operations as well as software.
Concentration is falling
The top five customers made up about 25% of revenue in the first nine months of 2026. Accounts beyond the top five delivered about 79% of revenue in the September quarter, against about 64% in March. A single customer, labeled “Customer C,” went from 43% of revenue in 2023 to 11% in the first half of 2026. The top five did not shrink: each set a revenue record in the September quarter, and the rest of the base simply grew faster.
Five more numbers worth knowing
- Third-quarter revenue was $17.0 billion, up 46.7% on the second quarter, which had grown about 140% on the first.
- The third quarter brought a $567 million operating loss, after $974 million of operating income in the second.
- Most of the $80.7 billion first-half GAAP net loss, $72.4 billion of it, comes from revaluing convertible notes and SAFEs.
- Revenue per employee tops $6.6 million on a trailing basis, against roughly $300,000 to $500,000 at strong public B2B companies.
- Customers include every one of the ten biggest banks and nine of the ten biggest drugmakers.
What other B2B teams can copy
Few companies will see a 900% retention rate. Five measurements travel well, though: net revenue retention on usage accounts reported apart from seats, the count of $100,000-plus customers and its growth, inference cost against revenue each quarter, how many top customers adopt a second product, and spend as a share of customers’ total expenses. The Anthropic S-1 makes a simple case for tracking each of them on a quarterly schedule.
Source: SaaStrAI